Motivation
I had an Enphase solar system installed in 2020 and the default logging interval for the Enphase appliance was 15 minutes. Being the data hoarder I am, a 15 minute interval was far too long and I wanted closer intervals to see near real-time performance of my solar modules.
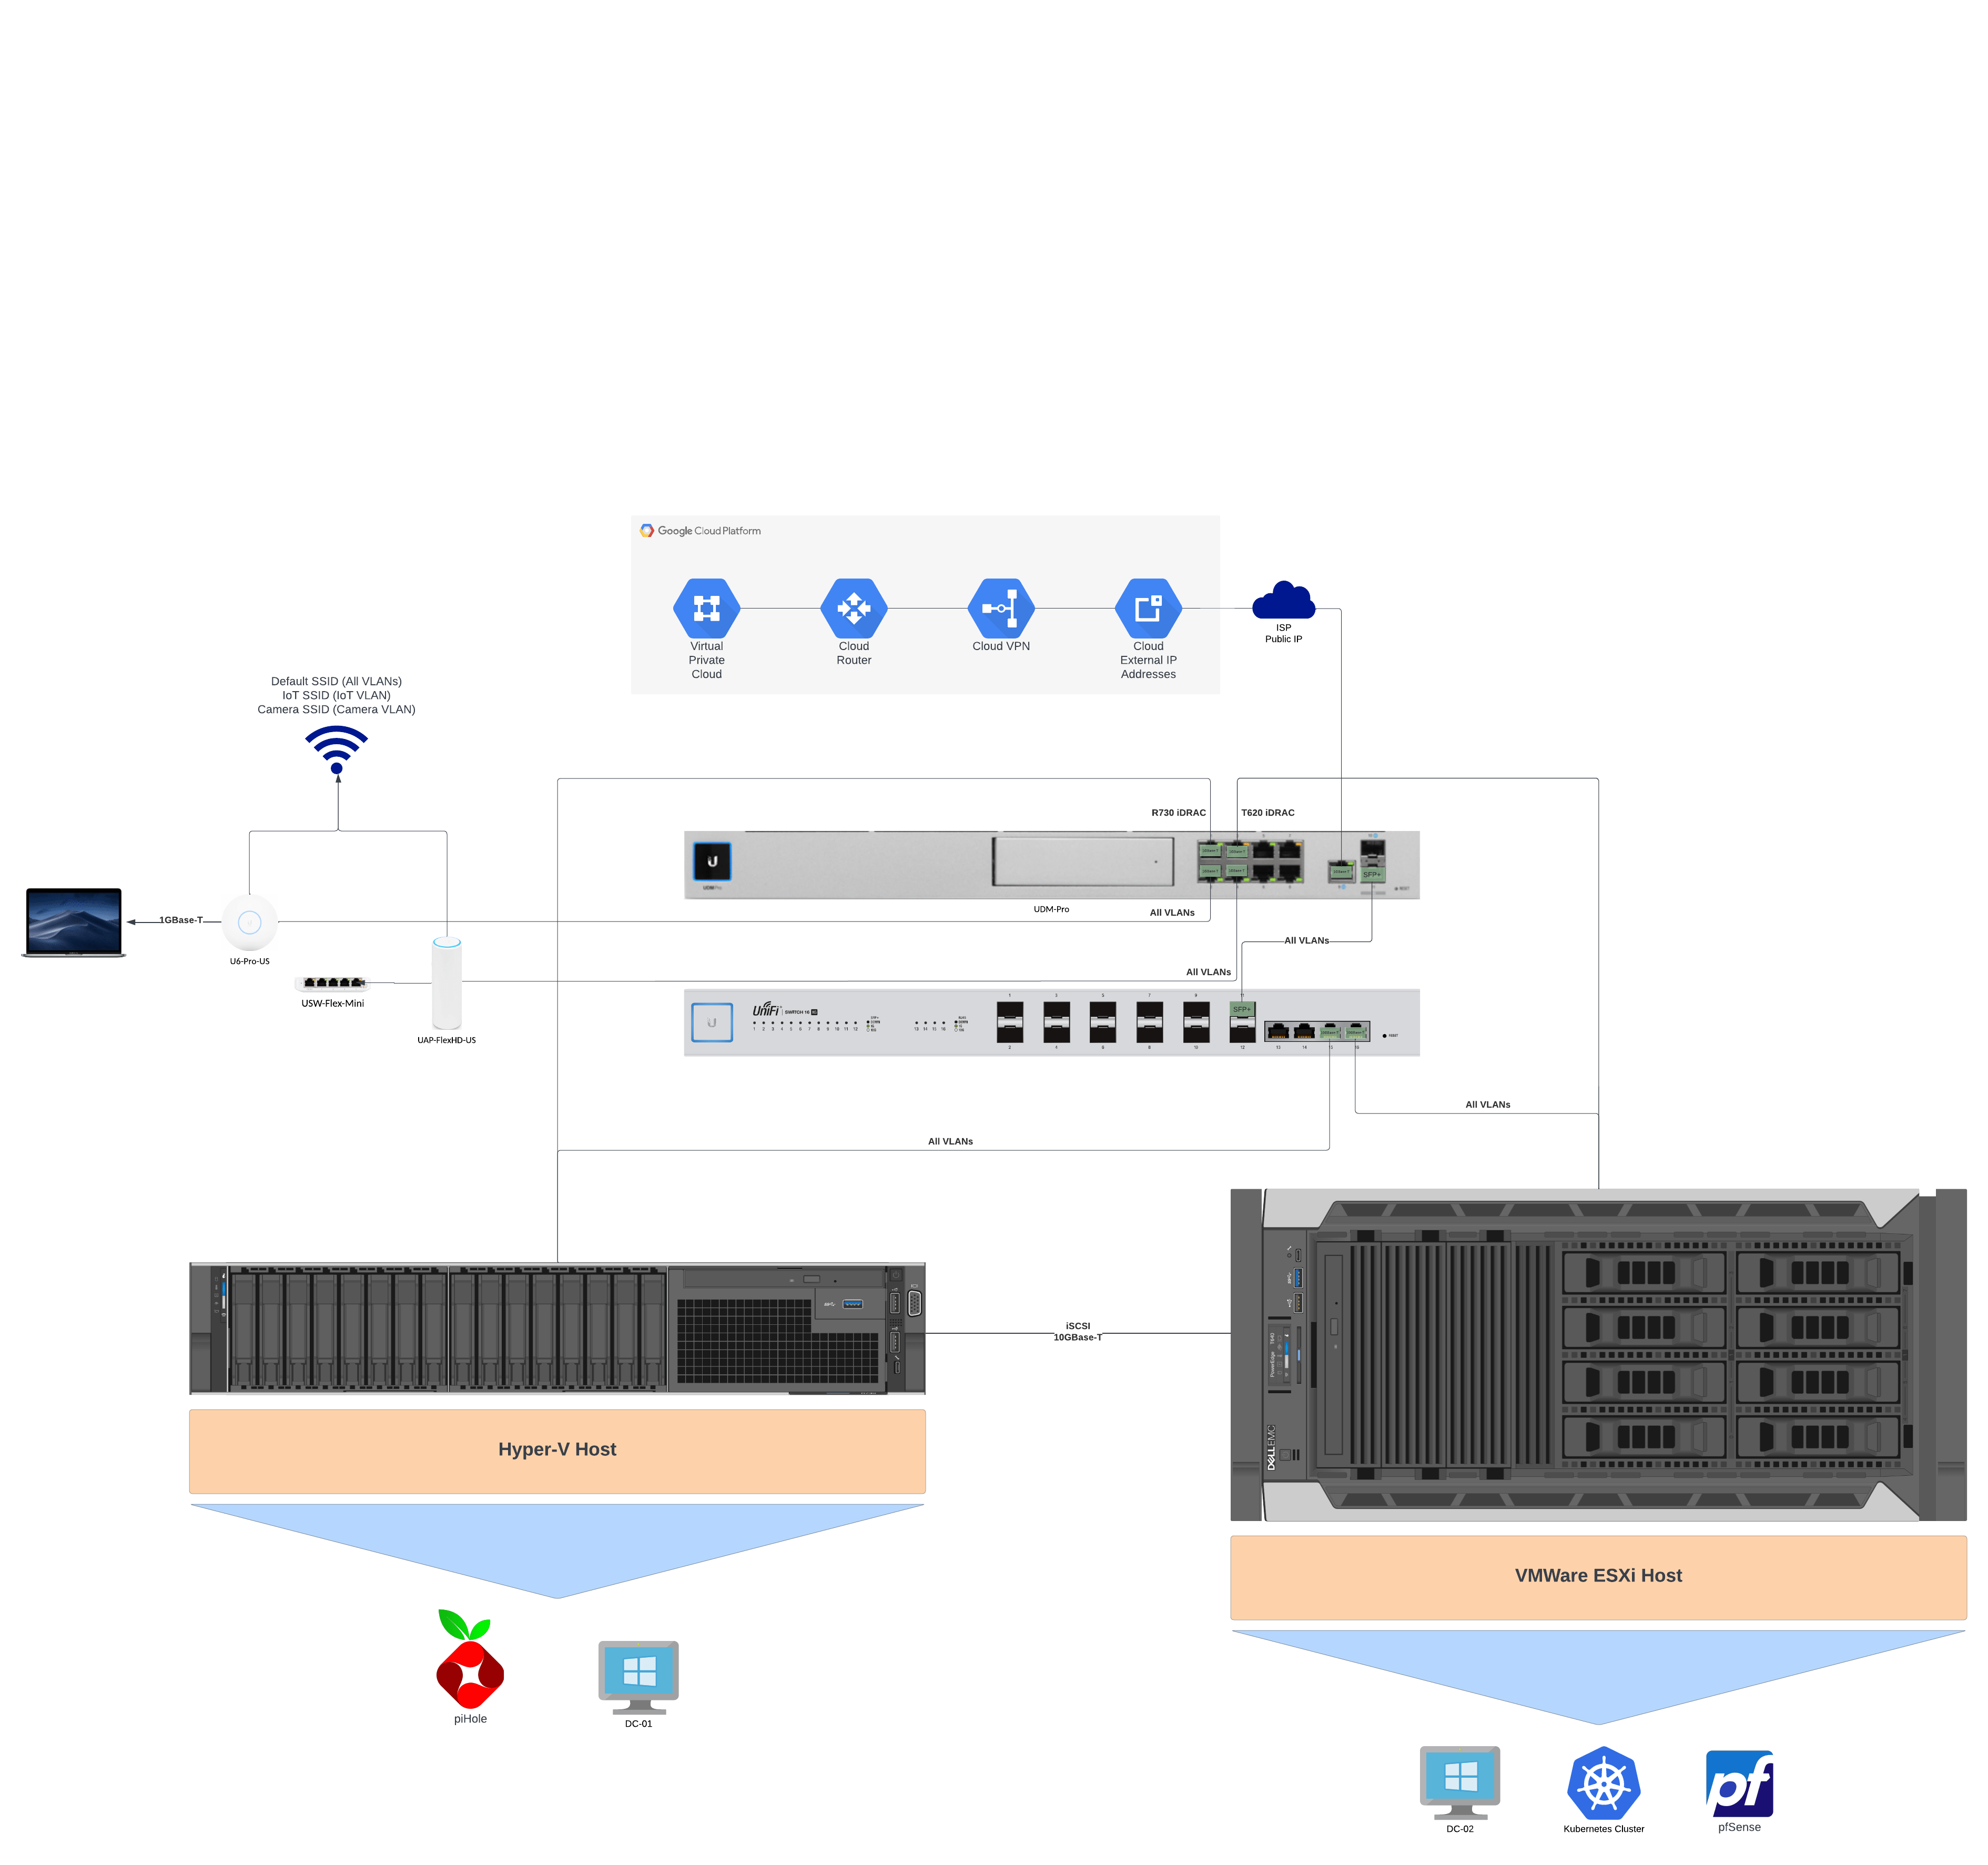
Luckily I already had a influxdb instance setup and previously used telegraf to monitor an assortment of random things. I have influxdb and telegraf running on Kubernetes but this could easily be done on platforms as well.
Telegraf Setup
Overall Monitoring Conifg
To scrape overall production and consumption metrics, the endpoint http://envoy/production.json is used. No authentication is required and I have it set to collect at a 5s interval. With telegraf’s http plugin.
| # Global tags can be specified here in key="value" format. | |
| [global_tags] | |
| # Configuration for telegraf agent | |
| [agent] | |
| interval = "5s" | |
| round_interval = true | |
| metric_batch_size = 1000 | |
| metric_buffer_limit = 10000 | |
| collection_jitter = "1s" | |
| flush_interval = "30s" | |
| flush_jitter = "5s" | |
| precision = "" | |
| hostname = "" | |
| omit_hostname = false | |
| ############################################################################### | |
| # OUTPUT PLUGINS # | |
| ############################################################################### | |
| # Configuration for sending metrics to InfluxDB | |
| [[outputs.influxdb]] | |
| urls = ["http://influxdb.default.svc.cluster.local:8086"] | |
| database = "Envoy" | |
| ############################################################################### | |
| # INPUT PLUGINS # | |
| ############################################################################### | |
| [[inputs.http]] | |
| urls = [ | |
| "http:/[ENVOY_IP]/production.json" | |
| ] | |
| method = "GET" | |
| timeout = "5s" | |
| data_format = "json" |
There is another endpoint at http://envoy/stream/meter that provides roughly the same data but in a continuous data stream. However this requires you to authenticate with the installer account.
The password is generated from the Envoy’s serial number you can find a python program that calculates the password here.
data: {
	"production": {
		"ph-a": {
			"p": -0.0,
			"q": 246.83,
			"s": 250.973,
			"v": 116.644,
			"i": 2.152,
			"pf": 0.0,
			"f": 60.0
		},
		"ph-b": {
			"p": 0.0,
			"q": 249.456,
			"s": 253.101,
			"v": 117.464,
			"i": 2.155,
			"pf": 0.0,
			"f": 60.0
		},
		"ph-c": {
			"p": 0.0,
			"q": 0.0,
			"s": 0.0,
			"v": 0.0,
			"i": 0.0,
			"pf": 0.0,
			"f": 0.0
		}
	},
	"net-consumption": {
		"ph-a": {
			"p": 1105.994,
			"q": -353.462,
			"s": 1208.699,
			"v": 116.647,
			"i": 10.344,
			"pf": 0.91,
			"f": 60.0
		},
		"ph-b": {
			"p": 500.877,
			"q": -206.518,
			"s": 606.291,
			"v": 117.436,
			"i": 5.16,
			"pf": 0.83,
			"f": 60.0
		},
		"ph-c": {
			"p": 0.0,
			"q": 0.0,
			"s": 0.0,
			"v": 0.0,
			"i": 0.0,
			"pf": 0.0,
			"f": 0.0
		}
	},
	"total-consumption": {
		"ph-a": {
			"p": 1105.994,
			"q": -600.292,
			"s": 1457.715,
			"v": 116.646,
			"i": 12.497,
			"pf": 0.76,
			"f": 60.0
		},
		"ph-b": {
			"p": 500.877,
			"q": -455.973,
			"s": 859.121,
			"v": 117.45,
			"i": 7.315,
			"pf": 0.58,
			"f": 60.0
		},
		"ph-c": {
			"p": 0.0,
			"q": 0.0,
			"s": 0.0,
			"v": 0.0,
			"i": 0.0,
			"pf": 0.0,
			"f": 0.0
		}
	}
}
The stream endpoint outputs a broken JSON file and you need to add mustaches to the beginning and end of the each data chunk.
I played around with it a little but was not able to find an easy way to do this while maintaining the stream.
Module Monitoring Config
Module monitoring is done via the telegraf’s exec plugin due to the lack of http digest support from the http plugin. I know, there probably is a better way to do it, but it works.
This endpoint requires digest authentication. The user in this case is envoy and the password is the last 6 digits of your serial number. You can find your serial number by visiting http://envoy/home.
| # Global tags can be specified here in key="value" format. | |
| [global_tags] | |
| # Configuration for telegraf agent | |
| [agent] | |
| interval = "60s" | |
| round_interval = true | |
| metric_batch_size = 1000 | |
| metric_buffer_limit = 10000 | |
| collection_jitter = "0s" | |
| flush_interval = "30s" | |
| flush_jitter = "10s" | |
| precision = "" | |
| hostname = "" | |
| omit_hostname = false | |
| ############################################################################### | |
| # OUTPUT PLUGINS # | |
| ############################################################################### | |
| # Configuration for sending metrics to InfluxDB | |
| [[outputs.influxdb]] | |
| urls = ["http://influxdb.default.svc.cluster.local:8086"] | |
| database = "Envoy" | |
| ############################################################################### | |
| # INPUT PLUGINS # | |
| ############################################################################### | |
| [[inputs.exec]] | |
| # Replace pass with last 6 digits of envoy serial number. | |
| commands = [ | |
| "curl -m 300 --digest -u 'envoy:[pass]' http://[Envoy_IP]/api/v1/production/inverters" | |
| ] | |
| timeout = "60s" | |
| data_format = "json" | |
| json_strict = true | |
| tag_keys = ["serialNumber"] |
Grafana Dashboard
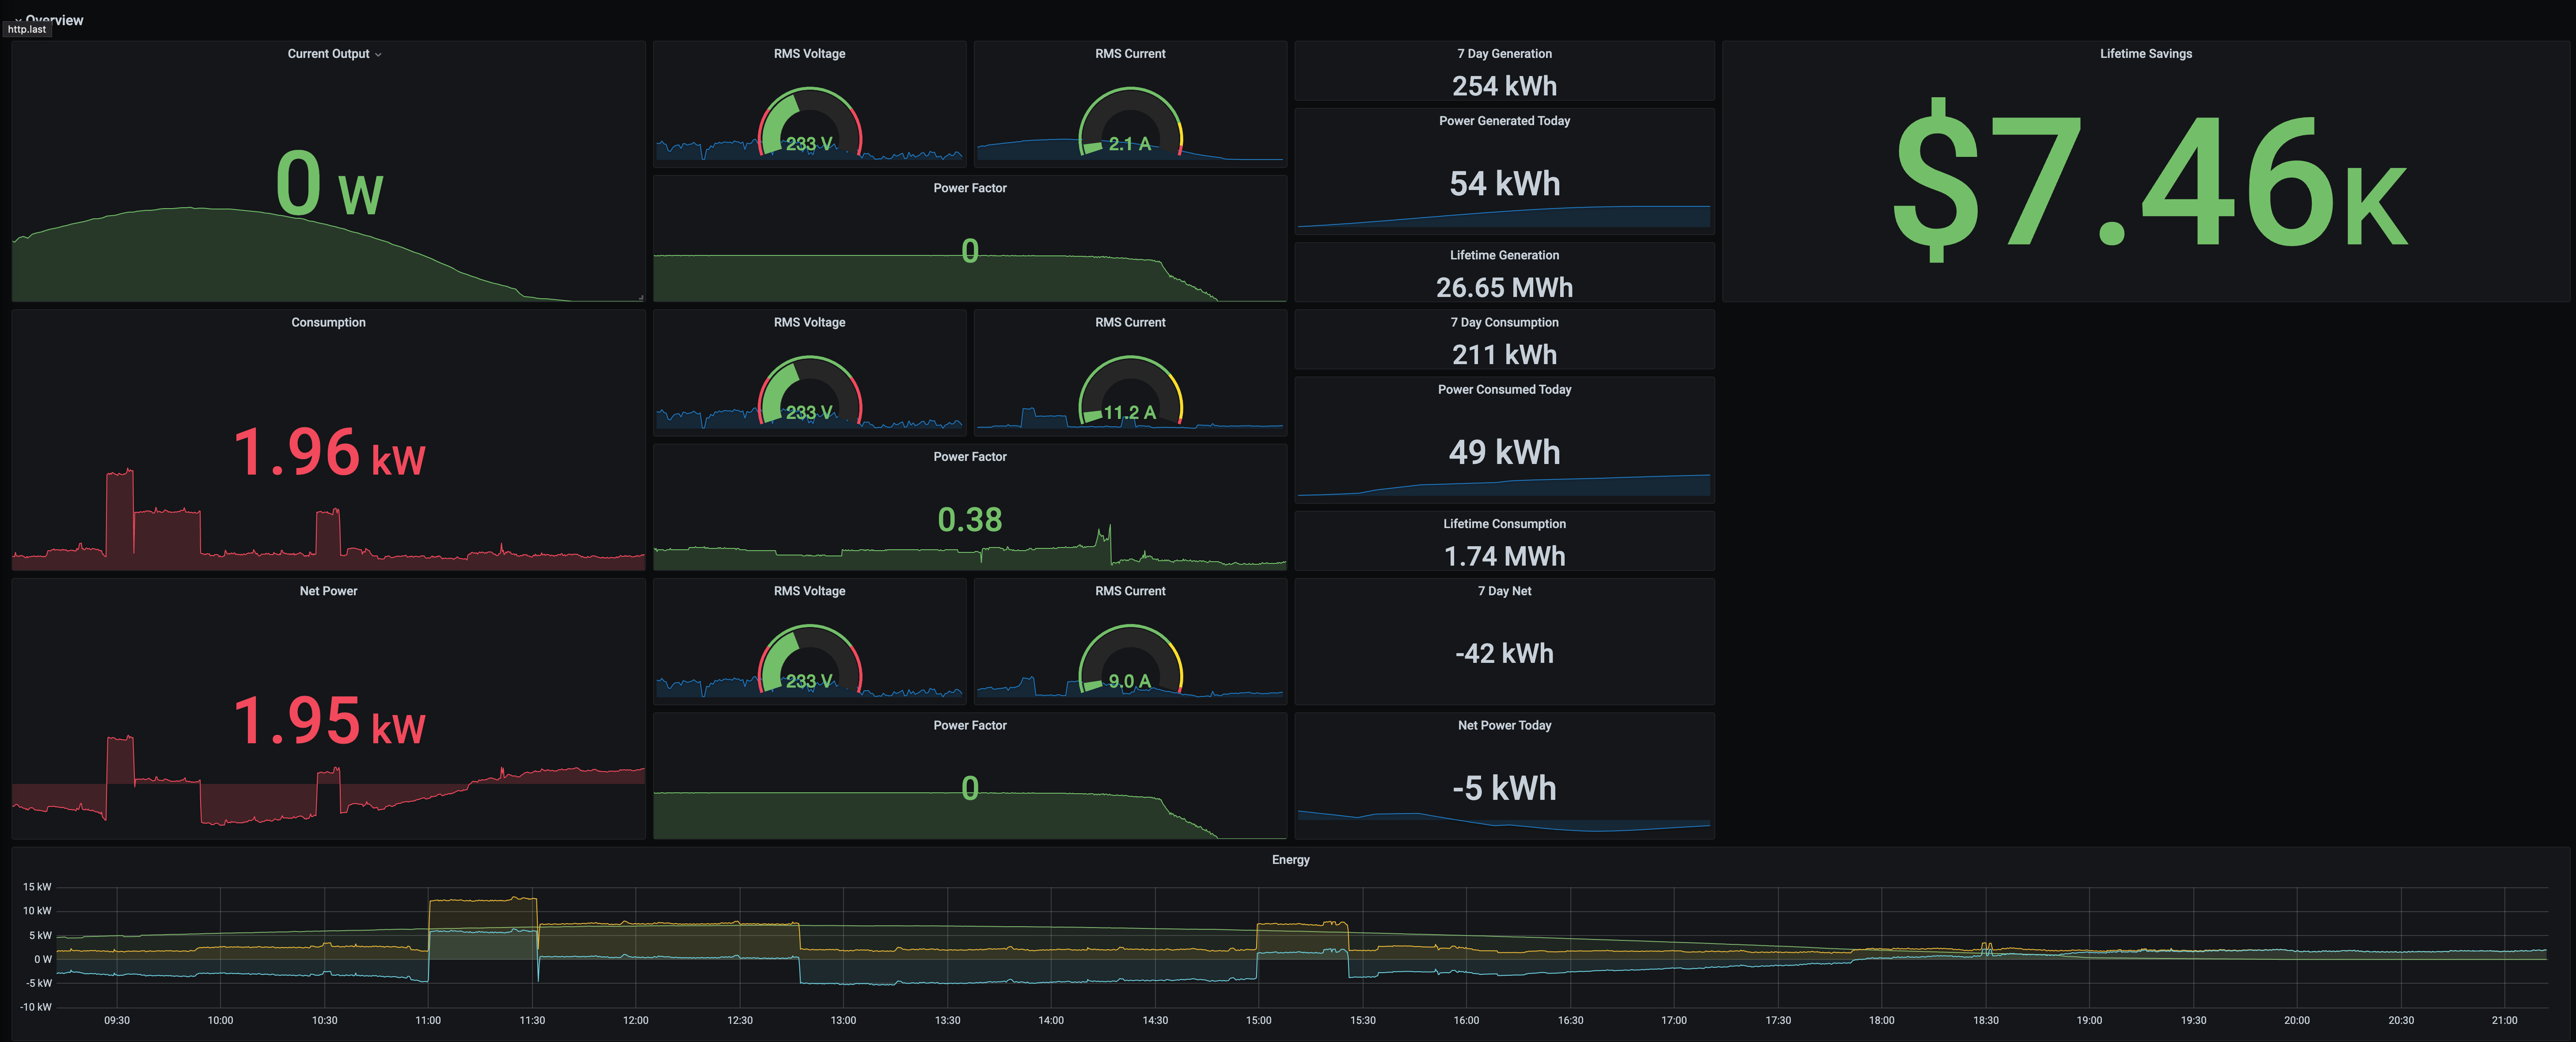
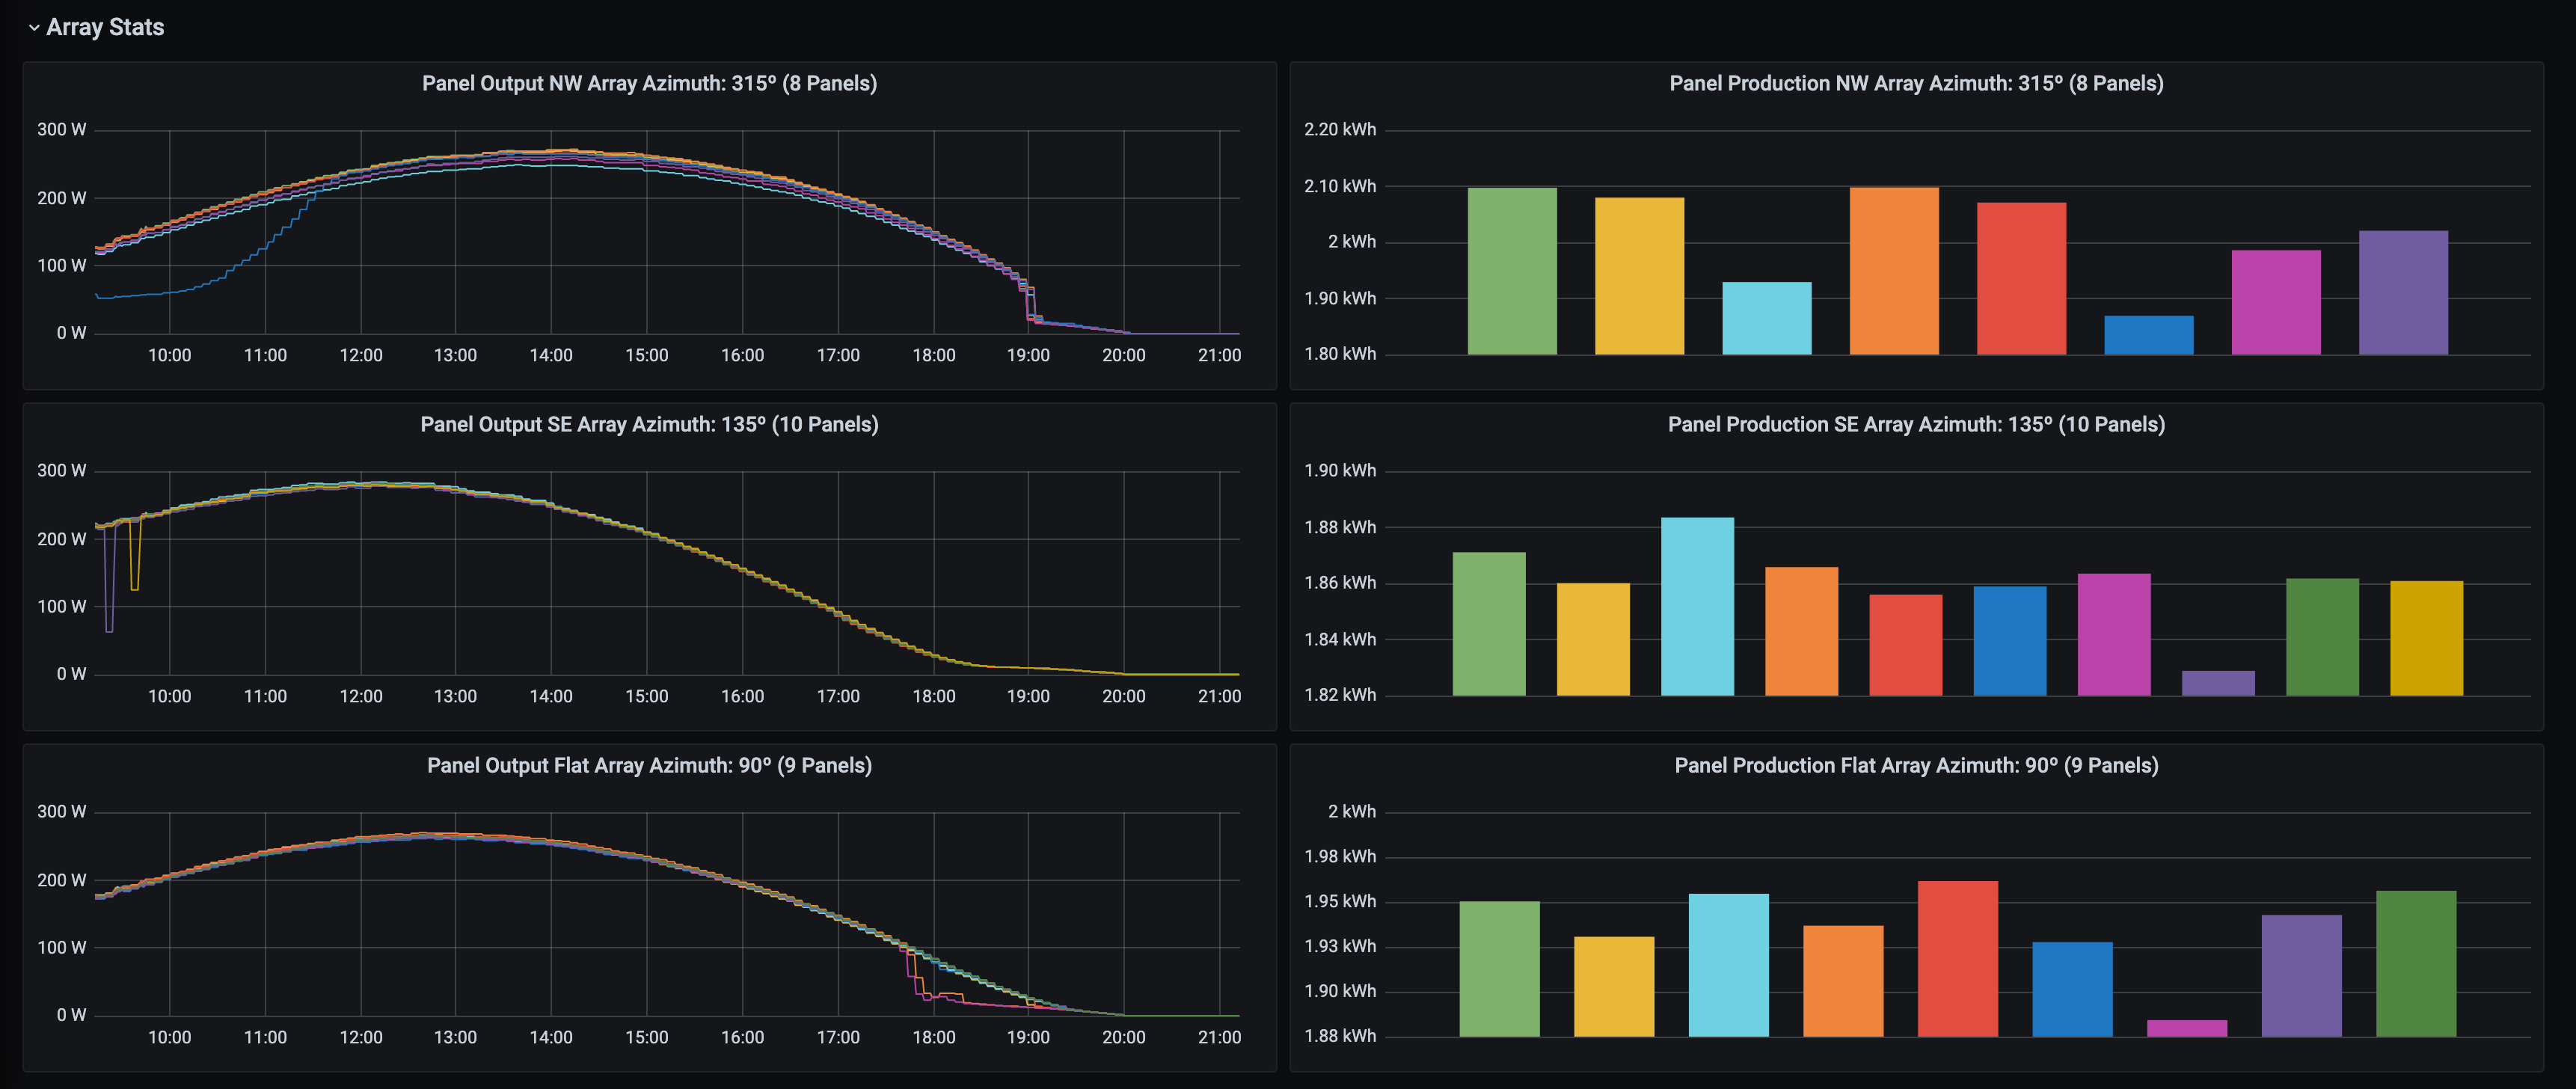
I threw together a quick grafana dashboard that utilizes some of the data scraped above and gives me near realtime monitoring capabilities.
Theres defiantly a lot of potential for visualization and data analysis with the scraped data. I will probably integrate calculated costs and net consumption for each TOU cost tier or alerts based on individual module output to notify me when a cleaning needs to be done in the future.
You can find the grafana code for the dashboard here.