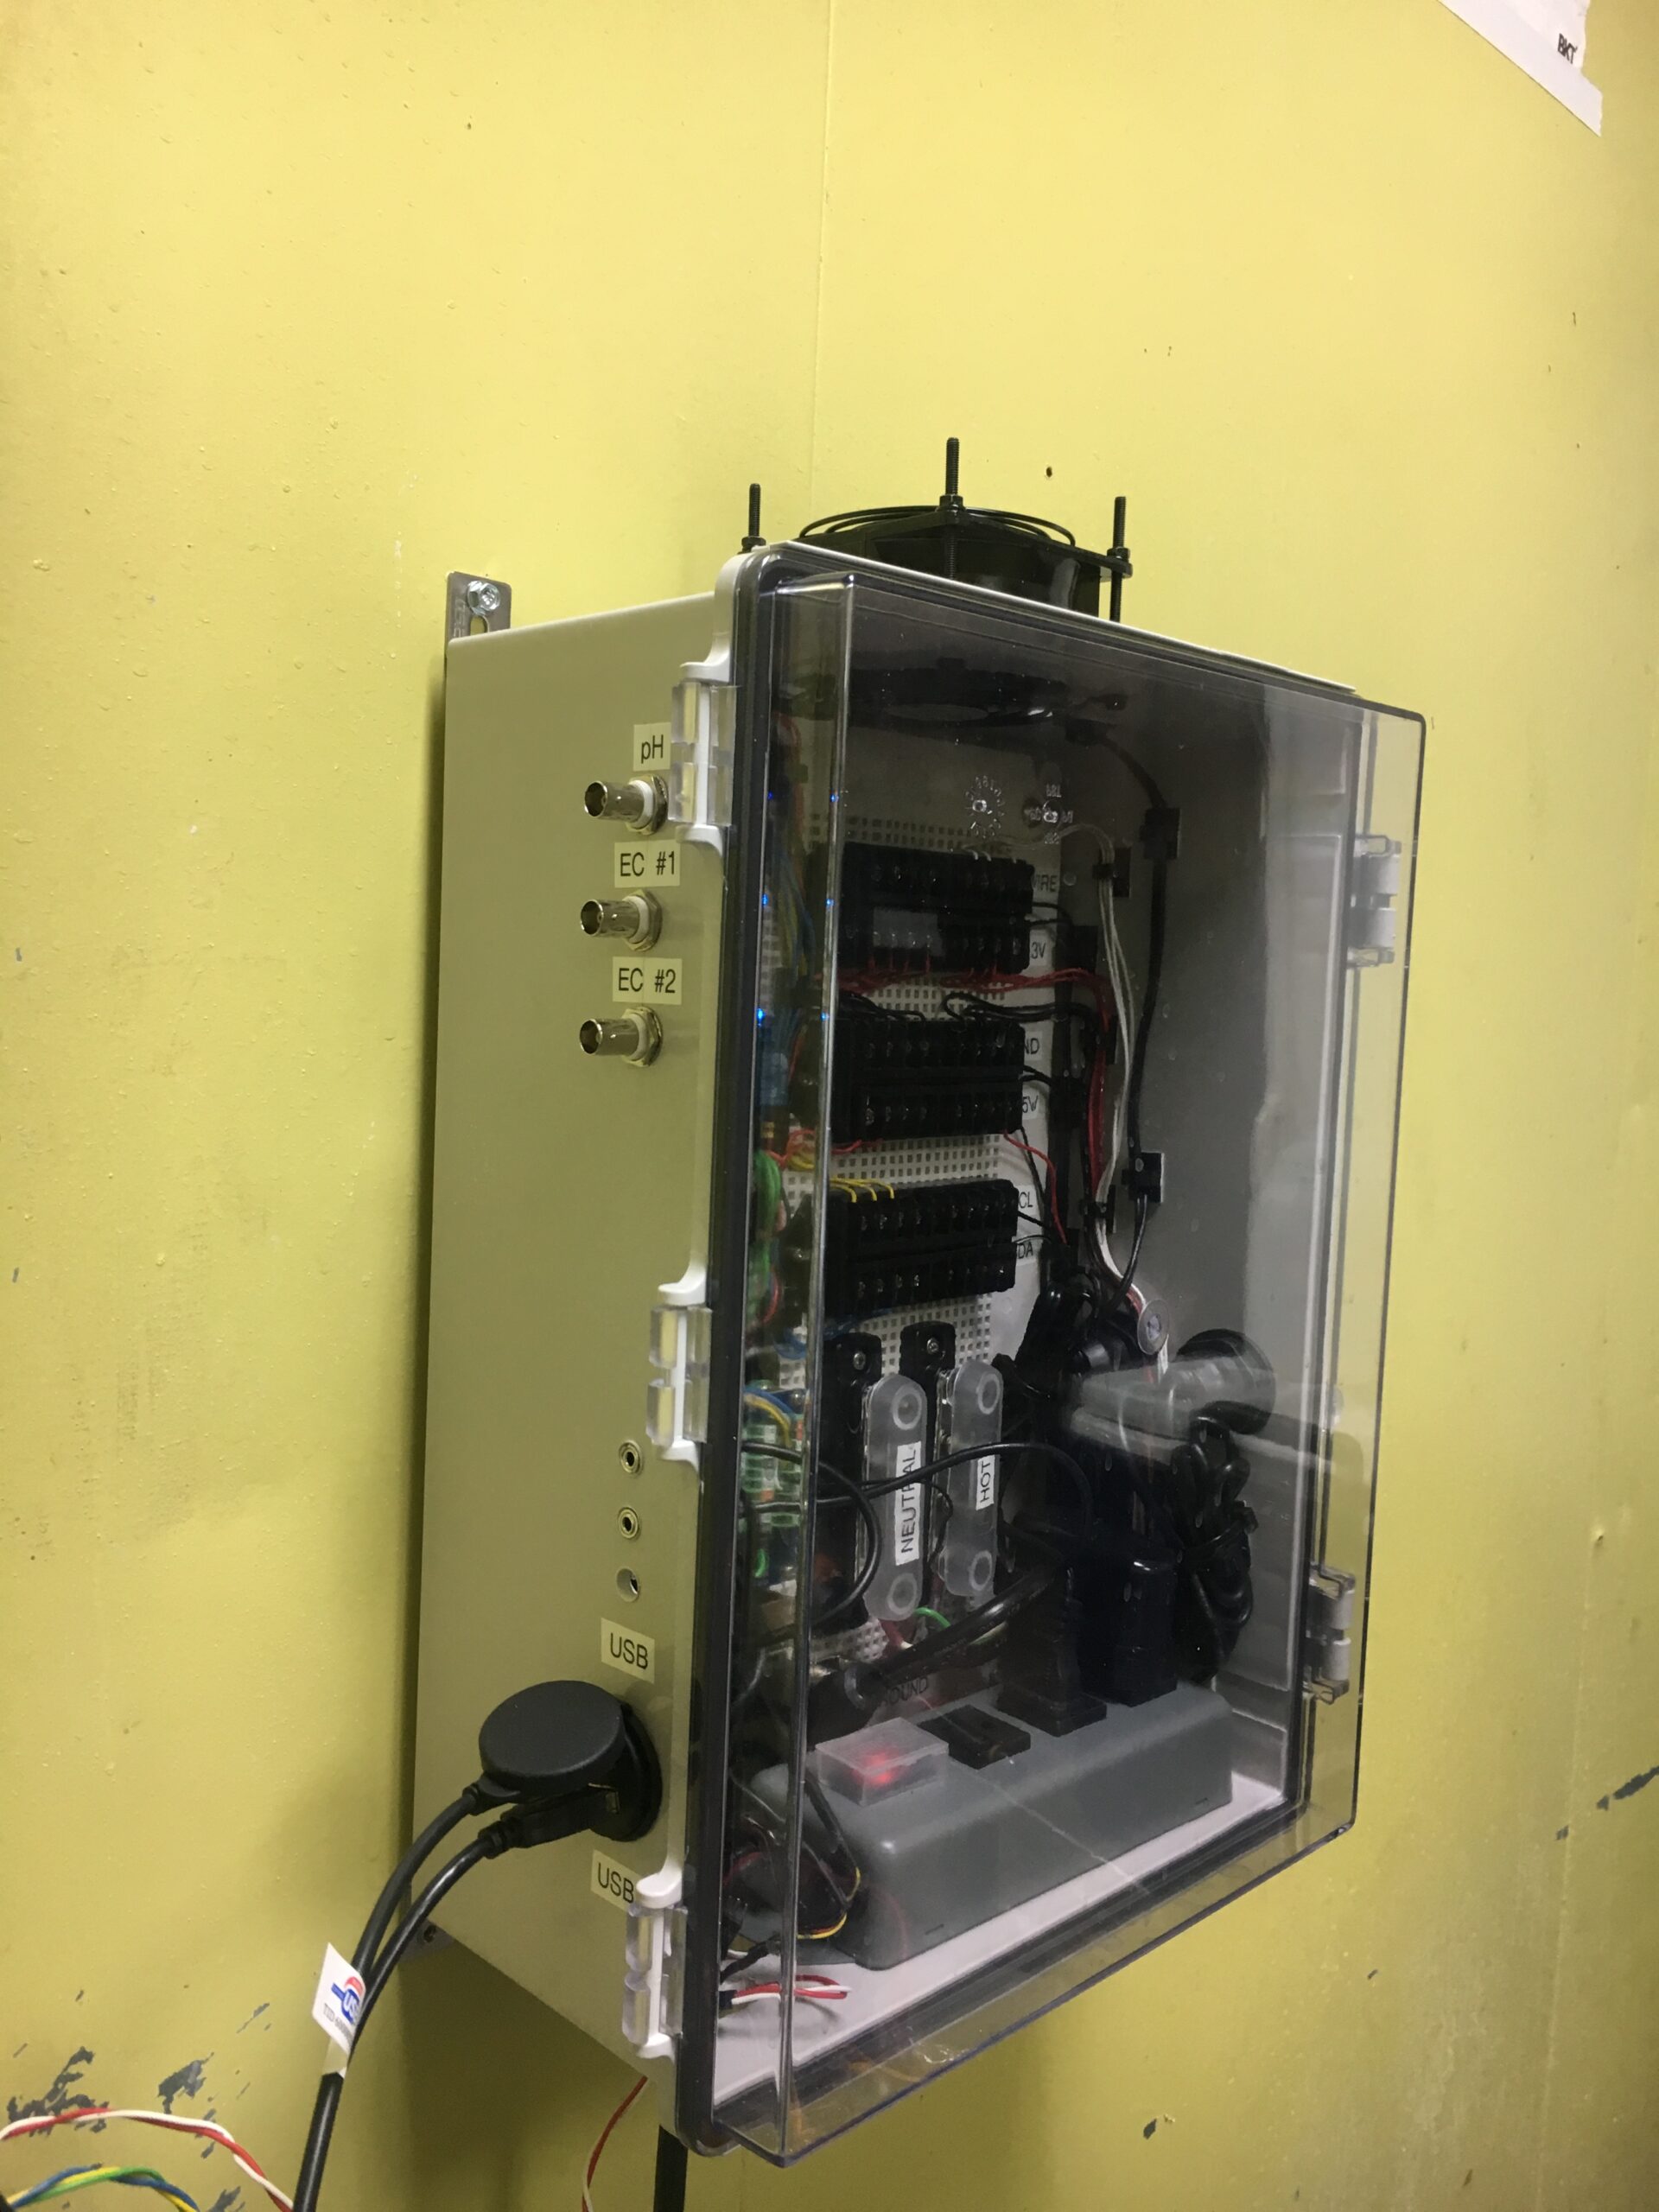

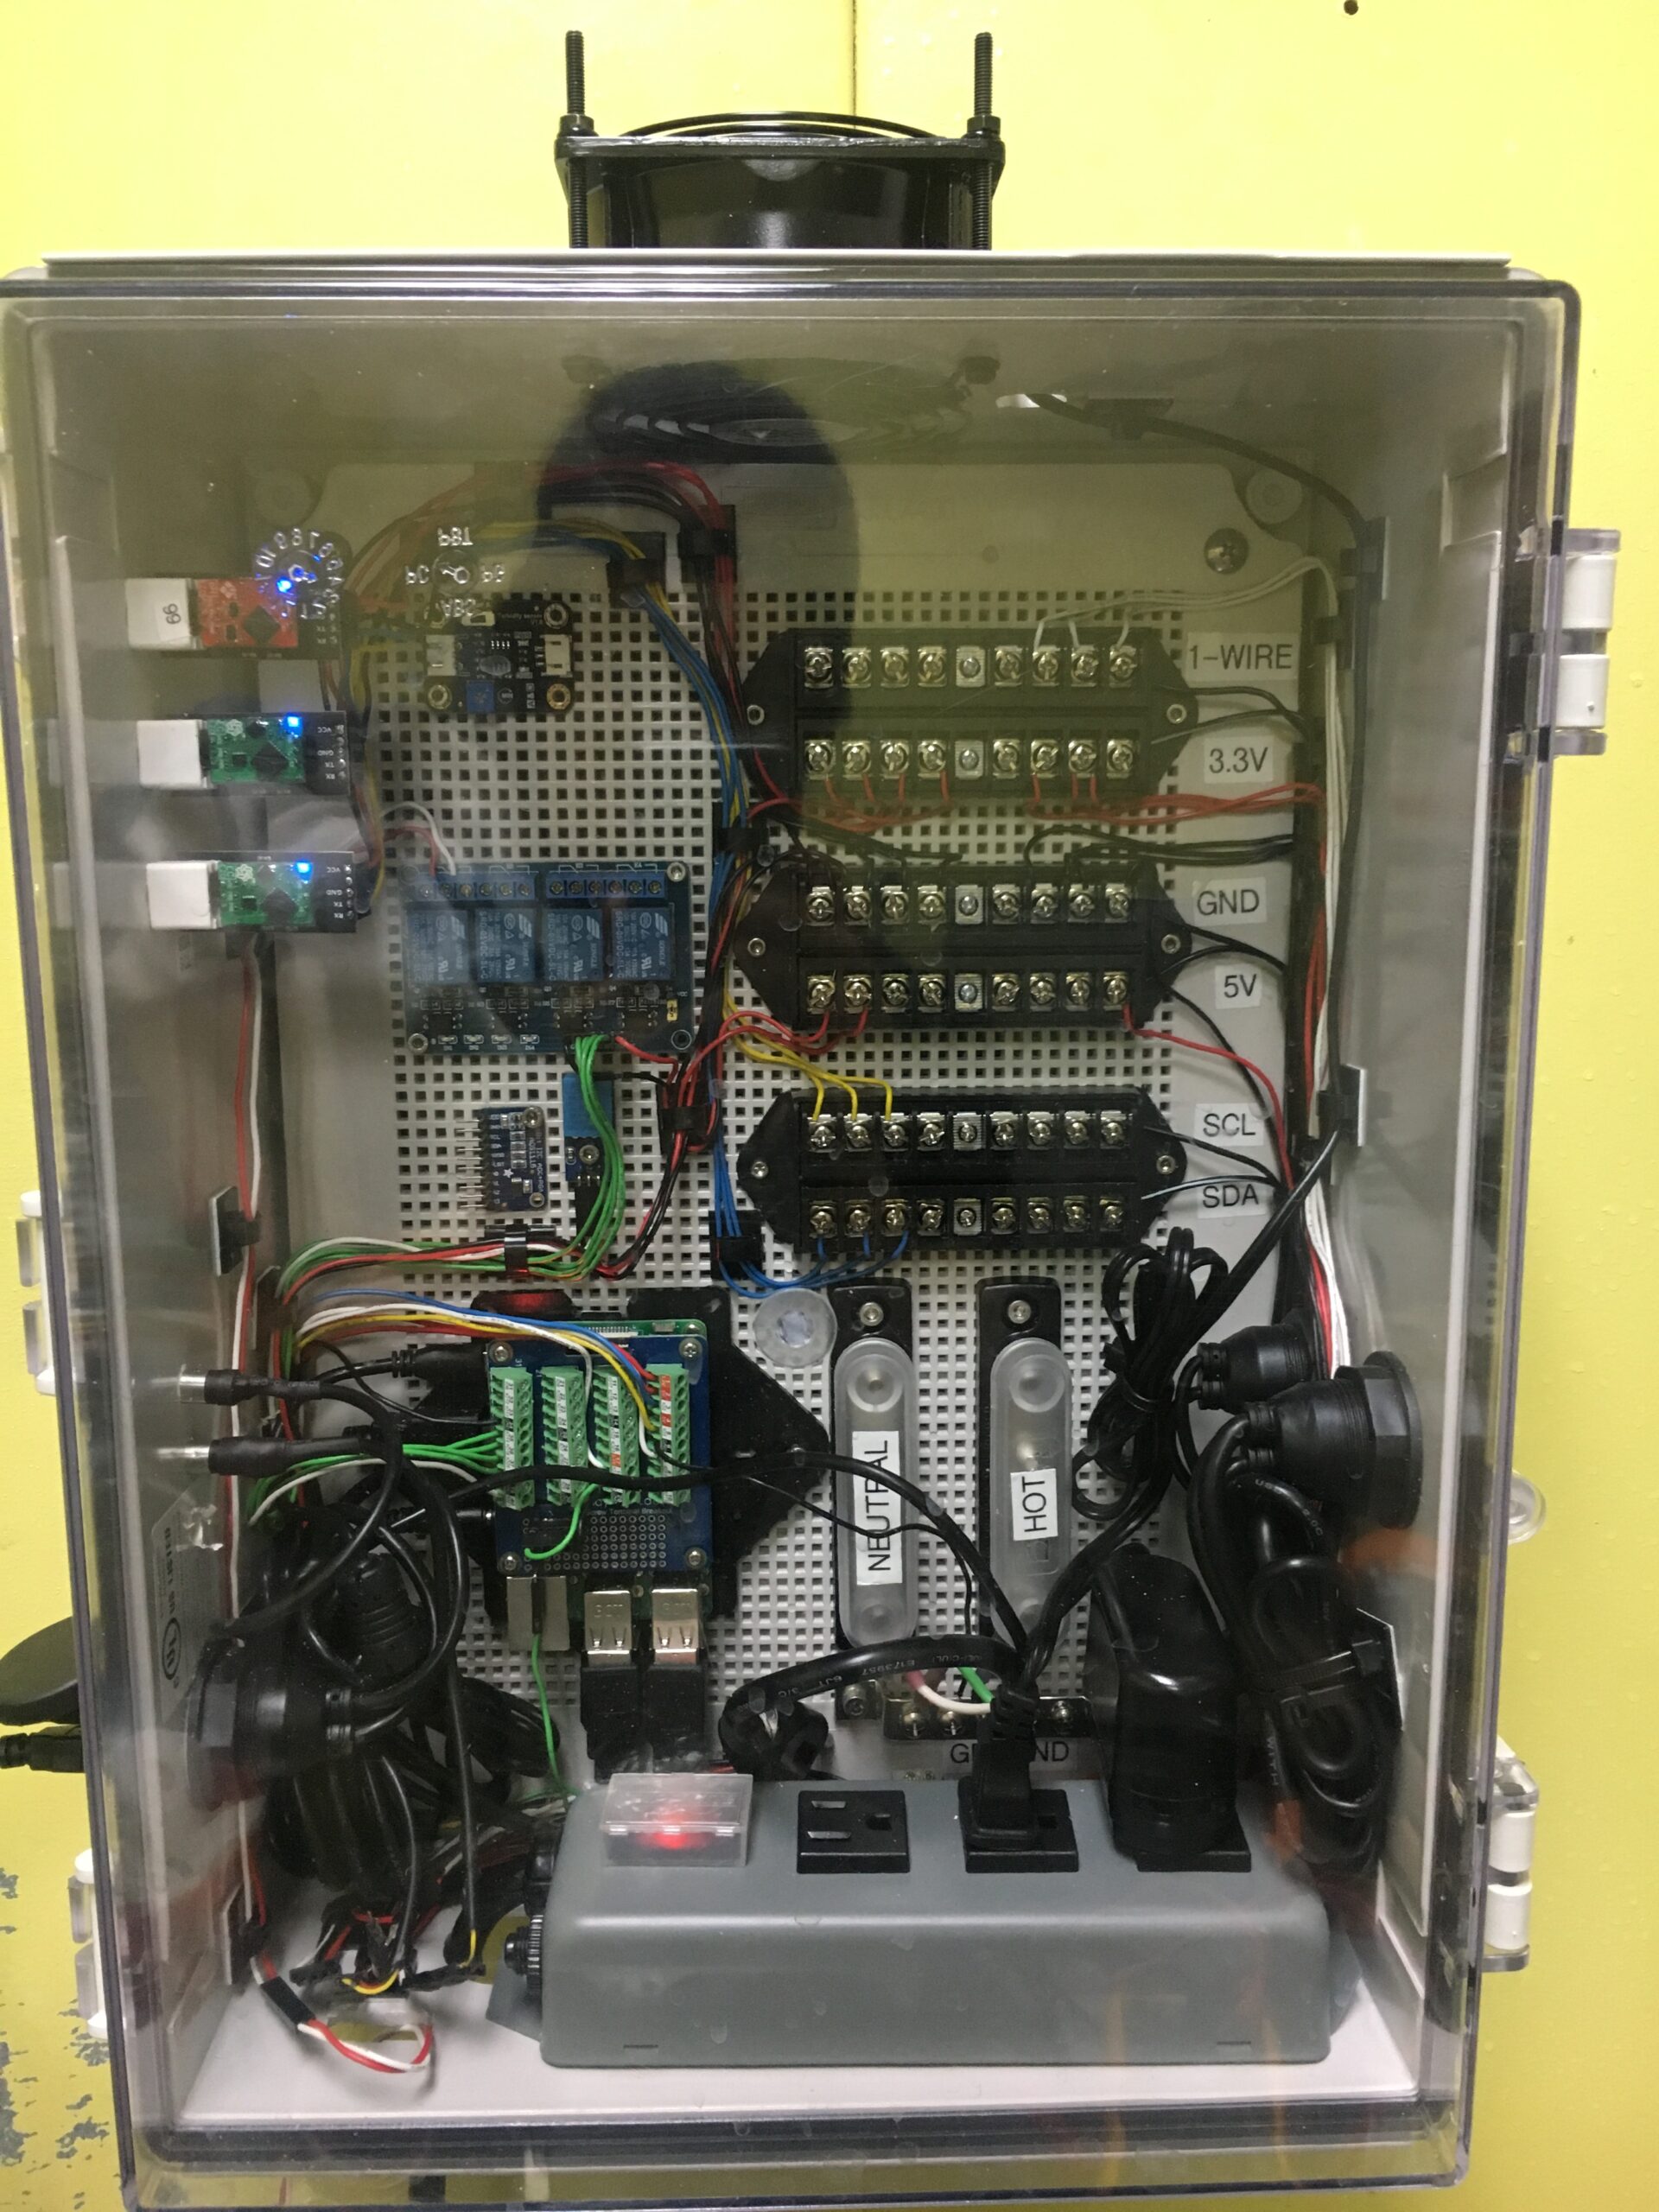
Recently I have been working on a project to automate a bench test for a membrane filtration system (basically my job) for the company I work for. I wanted something that was opensource and highly customizable so I decided to use a Raspberry Pi 3 Model B as the brain.
As many of you may know, industrial automation hardware and software are often proprietary pieces of equipment that cost thousands of dollars. Generally laboratory R&D processes generate mass amounts of data and generally consist of repetitive and tedious actions for the technician. I happened to be that unlucky technician that was collecting samples and taking measurements every 5-10 minutes for hours straight. After a few months I finally got so tired of doing my job I decided to automate it. However conventional industrial automation methods were out of the budget for this project. So I had to think out side of the box.
I started this from scratch about 3 months ago with absolutely no prior experience of programming or hardware. All of my experience came from google and various forums.
Materials
What it does
So basically the Raspberry Pi acts like a PLC/HMI combination and displays a UI through NodeRED’s dashboard node to any device on the LAN.
It’s main job is to trigger a relay at a specified liquid level. For people that know a little bit about chemical processes this is called a batch. That is the only “output” that it currently handles.
It’s secondary job is to collect data from various sensors and display them in the dashboard as well as data log all the data in a CSV format. Much like what you would see in an industrial skid for membrane filtration or any sort of unit op.
It collects the following process parameters.
- Level (volumetric based on feed vessel)
- Temperature
- Pressure
- pH
- Electrical Conductivity
- Flow
- Volumetric (w/ OpenCV 3 and a rotameter)
- Mass (w/ scale)
How it works
HMI/Logic: RPi running NodeRED and takes in data from various sensors and displays them with the dashboard node as well as saving the data at a 2 minute interval to a CSV document.
Temperature Sensors (RPi): Waterproof DS18B20 that have been modified to connect with a standard 3 conductor 3.5 mm connector for ease of removal and replacement. The RPi handles reading from the 1-wire bus.
I initially used DuPont connectors but the connection was flimsy and did not feel “industry” worthy. Also the diameter of the DS18B20 has an OD of 1/4″ so you can use a 1/8″ Push-to-Connect fitting to fit one of these inline.

pH & Conductivity (RPi): The pH and conductivity (K 1,0) probes are standard BNC connector probes from Atlas Scientific and connect to their pH and EC Circuits through a voltage isolator board also provided by them. All 3 circuits run off of 3.3V from the Pi and connect through I2C. Atlas Scientific also offered a variety of environmental sensors targeted for the prosumer hydroponics/aquarium market. Their circuits and sensors have laboratory grade reliability and accuracy.
The I2C commands were written by me in NodeRED. They allow me to toggle continuous polling with automatic temperature compensation referenced from a DS18B20 and calibrate both pH and EC circuits through the UI.


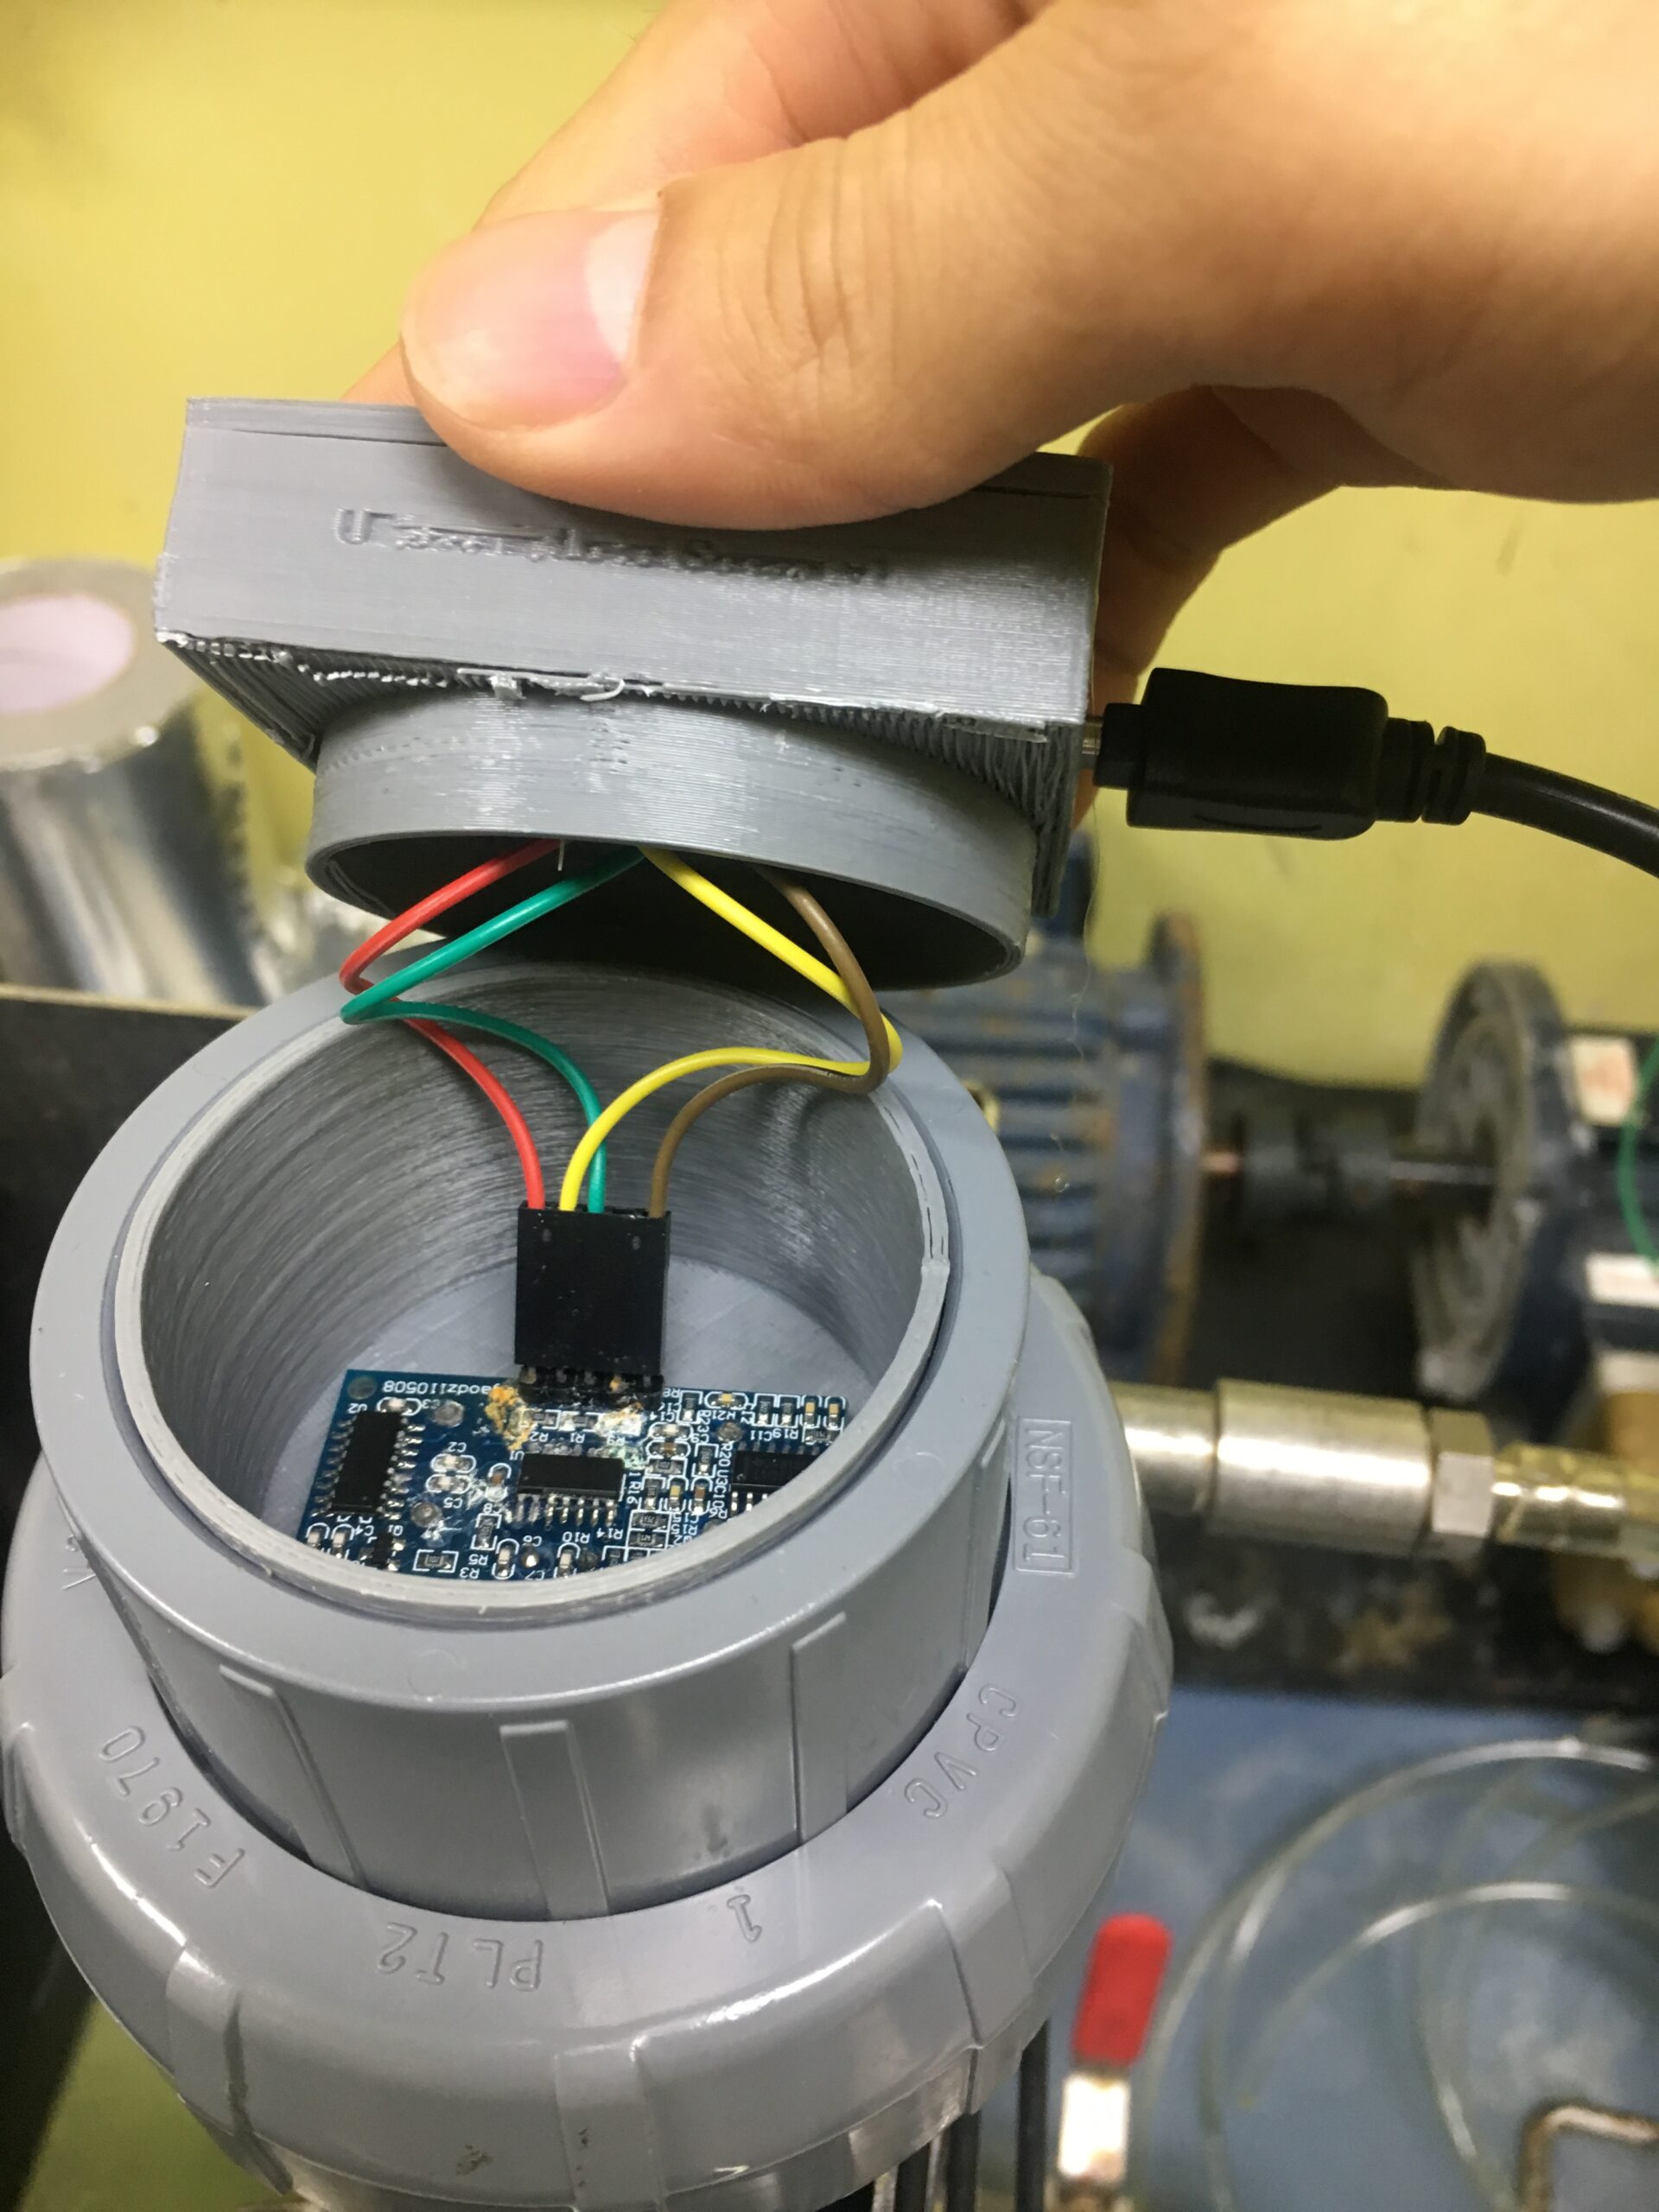
Level Sensor (Nano): Due to the timing nature of ultrasonic distance measurement, I decided to have a Arduino Nano knockoff control the HC-SR05 instead of the Pi (I got these because I did not want any headers and it is a pain desoldering the headers). I initially used an HC-SR04 and had the Pi control it through the pigpio library but kept running into sensor timeout errors (most likely due to the cheap sensors). After that I decided to use HC-SR05 and Nano’s to reduce the RPi’s clocks and increase measurement stability. The Nano runs the NewPing library and uses ping_median (5). Temperature and humidity compensations for the speed of sound was implemented but decreased sensor precision and was abandoned.
The housing was designed by me in Fusion 360 (no prior experience either) and 3D printed on my crappy Geeetech Delta G2S in PLA. The housing is designed to fit into a 2″ Schedule 80 PVC Union for easy removal and standardization. The PVC union connects to a 2″ PVC still pipe to compensate for foaming and help direct the beam. Currently I am seeing a resolution of around 0.2 cm – 0.4 cm.
The Nano is powered and communicates through USB serial with the Pi, where it passes through a lowpass filter in NodeRED and a few function nodes to calculate the volume of the tank from its dimensions and height. The volume is then used to calculate the current level. Due to the limited height (~30 cm) of the tank currently the highest resolution that can be achieved is around 1%.
You can find the tutorial for this sensor at DIY Affordable Ultrasonic Level Sensor for R&D Process Measurement Tutorial (Arduino Nano + HC-SRF05)


Pressure Sensor (Nano): The pressure transducer I am using is a cheap 300 PSI automotive pressure sensor (5V Input 0.5 – 4.5V Output) I found on Amazon. I chose this sensor because it fit with in my range of operating pressures and was with in the Nano’s ADC voltage range.
Since this sensor is quite far from the RPi and around 2 noisy electric motors controlled by VFD’s, I chose to minimize line run for the ADC read. I do have a 16 bit ADC in the RPis case but the Nano’s 10 bit ADC will work just fine giving me a resolution of ~0.02 bar (0.3 PSI). I did find out that this transducer was an absolute transducer since it was able to drop below 0.5V with a slight vacuum applied (the absence of vent holes should have gave it away). I calibrated the sensor in Excel comparing the raw ADC value and the pressure gauge to the left. The slope of the graph was surprising linear for the cost of the sensor.
The box for the Nano was also designed in Fusion 360 by me for this purpose.

Volumetric Flow (RPi): This was the most difficult sensor for me to assemble and program. The code is based on OpenCV 3 and a Brooks Instruments 4 – 50 ccm flowmeter was used. Building OpenCV 3 as already complicated on a Windows computer and doing it on a RPi was even more complicated, luckly this Tutorial by Adrian from pyimagesearch helped me out. Luckly I found a cheap webcam (it says 50MP) with just the right FOV and manual focus to fit in the box and have the entire flowmeter in frame, well not quite but close enough.
The OpenCV 3 script basically takes the video capture and changes it to grey scale and uses cv2.matchTemplate to match the current frame with a cropped picture I took of just the black float. It then maps the min and max locations and draws a rectangle. After that I created a variable that gives me the center point of the matched template horizontal pixel location (since my camera is mounted sideways).
Then I proceed to calibrate the flowmeter with excel and came out with a ridiculous order polynomial to get a solid R-squared value, this was due to weird scale that Brooks had. If anyone knows how why this non-log, quadratic, or linear scale is used please let me know. Anyways after a OCDing about the values not perfectly matching what I saw with my eye, even though the accuracy of the meter is ±5% FSV, I decided to split the calibration into two different regions. 0-10mL/min and 10-50mL/min, this gave me a nice and simple third order polynomial with 7 sig-figs.
There is also a switch tied to a 10K linear pot and a LED so you can get readings when the lights are off.
After my system’s maiden voyage and complete and utter failure of the flowmeter due to the characteristics of the feed I was testing, the permeate had increased adhesive properties. Which allowed for a bubble to adhere to the float and not come off no matter high much I shook or tapped on the flowmeter. I then decided create another form of flow measurement for samples that have adhesive properties.


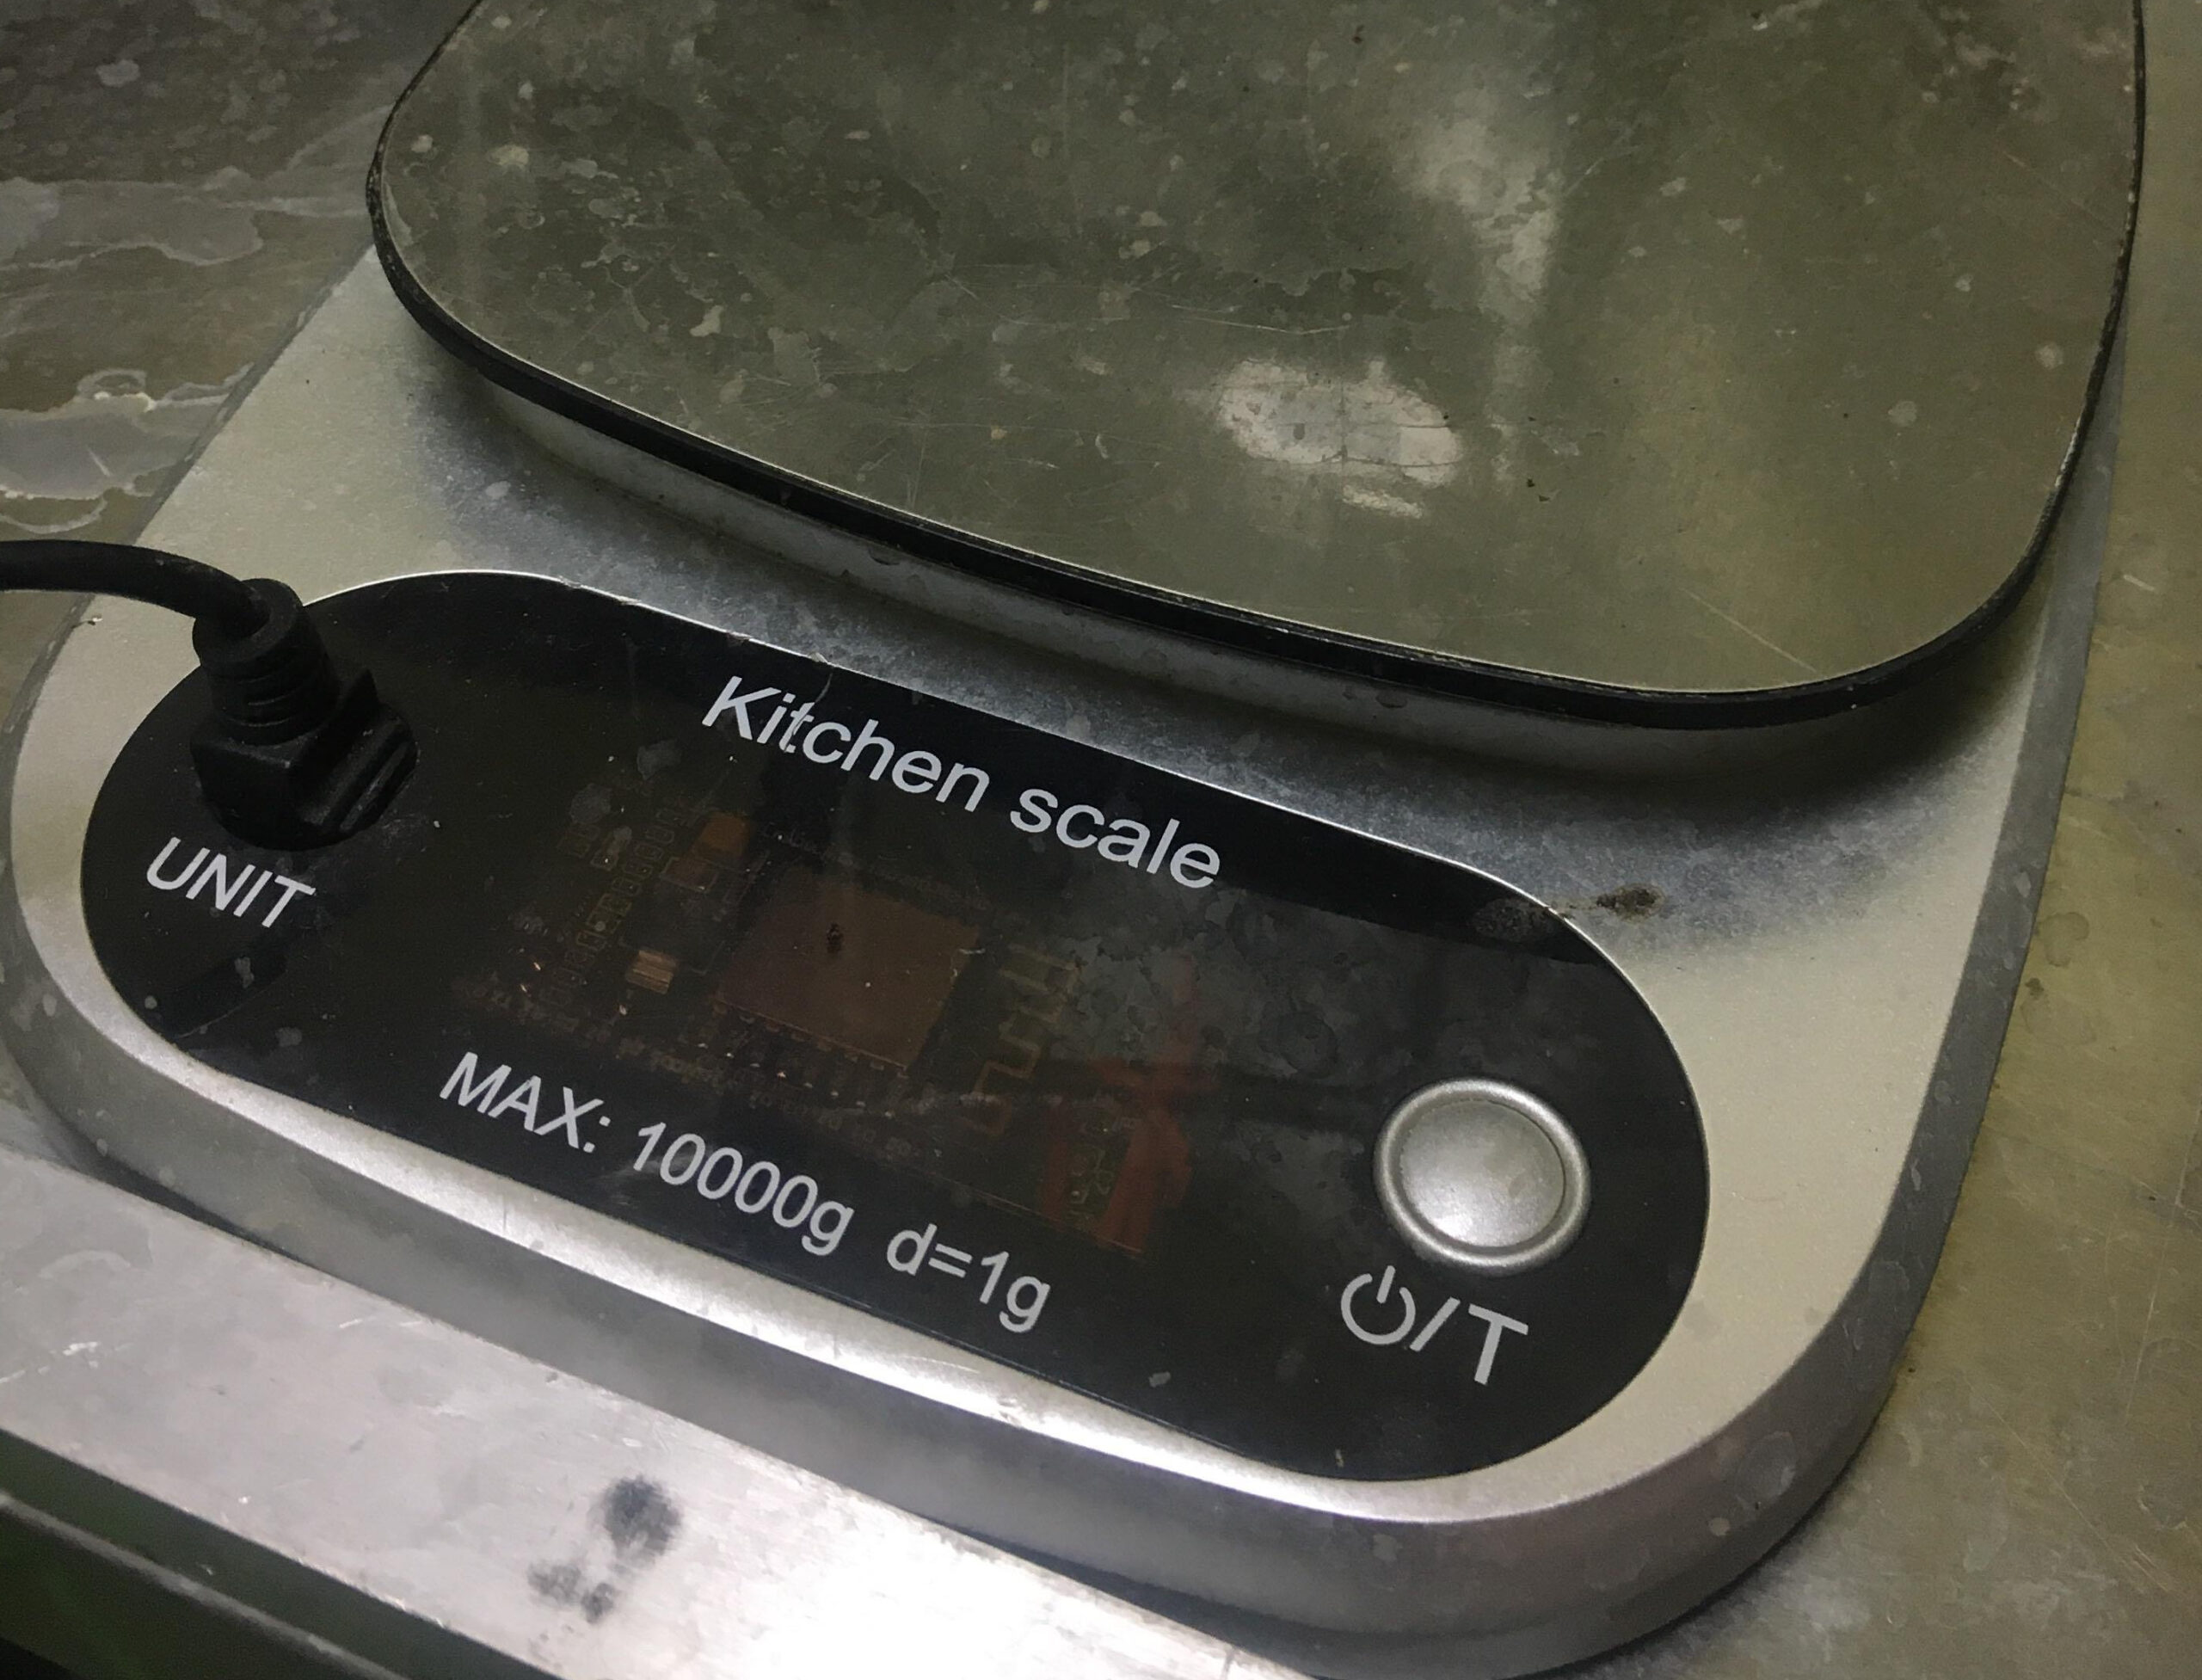
Mass Flow (ESP-8266+HX711): To fix the issues I encountered above, I decided to go with weighing the collected permeate and integrating with respect to time to find the mass flow. I purchased a cheap 10kg Kitchen Scale on Amazon because I was too lazy to build a housing and platform for a load cell from scratch. I then gutted the scale and kept only its tare button which I broke off of its PCB.
I then soldered the load cell to a HX711 24 bit ADC and then soldered that to a NodeMCU ESP-8266 Module. I added the original button to the ESP board as a DI with a pull up and programmed that in as a tare. I used the HX711 Arduino Library and ESP-8266 Arduino Core to program the ESP-8266. I then used PubSub Client to publish and subscribe to 3 MQTT topics on my RPi’s MQTT broker. The first subject are all the publications of the scale’s weight, subscribed by NodeRED, the second topic is the publication of the scales constant also, subscribed by NodeRED, and the third topic is the configuration topic published by NodeRED and subscribed to by the ESP to wireless tare, and calibrate the scale. NodeRED then takes 1 message every 2 minutes, ignoring the rest of the messages and calculates a rate.
I also made the built in LED of the ESP light up when you tare since it doesn’t have a display to confirm you successfully tared. The ESP is powered by a USB through a wall supply to ensure voltage stability for the HX711. With my environment and the quality of the original load cell that came with the scale, I am seeing a stable resolution of 0.5 g.
You can find the tutorial for this sensor at DIY Affordable WiFi Enabled Fluid Mass Flow Meter Tutorial (ESP-8266 MQTT Scale).

Relay Control (RPi): Controlling the pump and motor was the easier part of the project. The LS Industrial Systems VFD’s had a mode where you could connect a linear pot and a switch to control the VFD’s. I connected both of the commons together and then fed the power to the relay which is driven by 5Vs, operates on 3.3V logic and has built in flyback diodes. Next I connected 2 linear pots and mounted them to the outside of the box so that the frequency of each motor could be adjusted on the fly.

User Interface
The UI was created with NodeRED’s dashboard node. It consists of 4 pages, login, summary, graphs, and settings.
Login: Simple login using dashboards feature to disable their icons, linked to a json that stores the username and password.

Summary: Overview of all sensors in real time with gauges. Gives options for toggling polling of pH an EC sensors, start/stop VFD’s, data logging and various set points.
You can set the recovery percentage which will stop the pump and motor and set the temperature to which flux corrections are normalized to. Flux normalization are based upon the viscosity of pure water compared to the feed temperature.
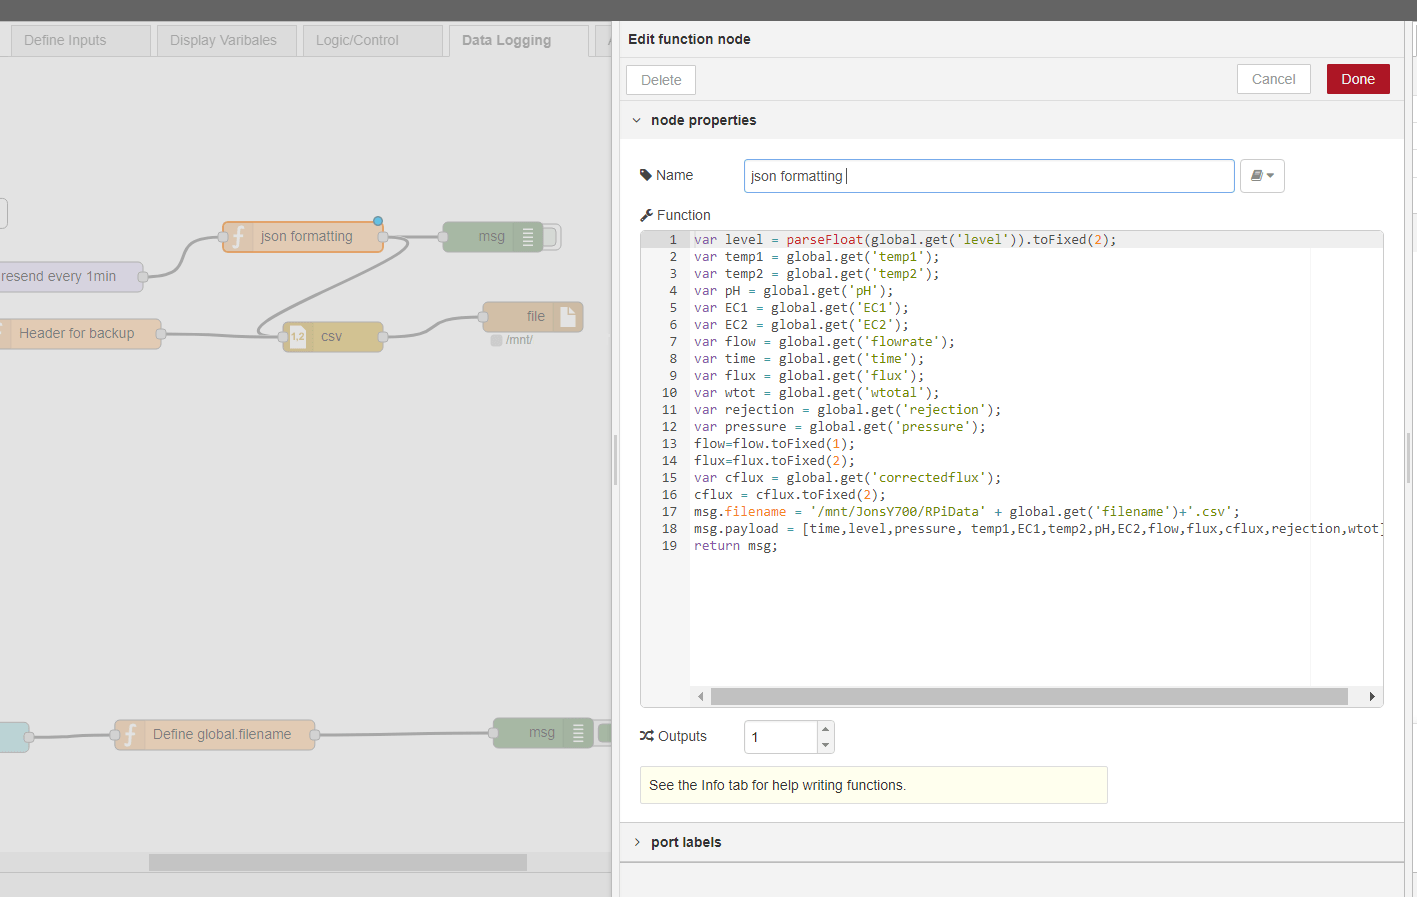
Data logging can be toggled on or off to start logging at 2 minute intervals to the specified file name. As soon as you press “start” a backup file is generated at 5 minute logging intervals. I added a DHT-11 that came with the IOT Starter Kit I bought at the beginning of this project, the original HC-SR04 also came from this kit.

Graph: Live time view of the sensors (this was taken when the RPi was responsible for the timing of the HC-SR05). Tthe oscillations in the level sensor have been less apparent after having the Nano control the timing.

Settings: This is where you configure all of your sensors for maximum accuracy. The only sensor that should be configured before every run is the level sensor
The level sensor settings give you the current distance in real time so that you can set the empty and full distance before every batch, mostly just the full distance because the empty distance should not change.
The pH and EC probs allow for push button 1-3 point calibrations (custom EC if needed), custom temperature compensations (if you dont want automatic), verfication of calibration and corrections and a sleep function.
The scale settings allow you to change the constant to calibrate the scale to a known weight.

Random Stuff


Below are the housings I have made for this project, they are available on my thingiverse, I have yet to print the 2 probe holder since during the time of writing this my new 3-D printer is ~80% built. The other two however are sized perfectly except the front pins that hold the Nano need to be broken off to fit the Nano in since I designed the mini USB port to rest in the hole.
Conclusion
For the cost of roughly $1,000 in materials (water quality sensors were expensive) and a few months of work. The project was a success, if we only account for materials and technician labor at around $15/hr, the project would have paid for its self in just under 2 weeks!
I had a great time working on this project and have learned a lot about hardware and software. This project is the reason why I started this blog in the first place. I would like to thank Tomorrow Water for funding this project and dealing with my trail of wire insulation, solder nuggets, plastic shavings, partially disassembled sensors, and breadboard chaos around the office.
I hope this helps someone and if you would like me to make a tutorial or add any additional information please feel free to ask.
Update: The system has been in operation for more then 2 years and has saved countless man hours and several more functions have been added on, including a solenoid valve based temperature control system.
The Node-Red code for this project can be found here.


Grand poteau ! Merci pour prendre le temps d’écrire quelque chose qui est réellement en valeur la lecture. Trop souvent je trouve l’information inutile et pas quelque chose qui sont réellement appropriées. Merci pour votre dur labeur.
Grand poteau ! Merci pour prendre le temps d’écrire quelque chose qui est réellement en valeur la lecture. Trop souvent je trouve l’information inutile et pas quelque chose qui sont réellement appropriées. Merci pour votre dur labeur.
Thanks for this tremendous post, I am glad I noticed this website on yahoo.
Thanks for this tremendous post, I am glad I noticed this website on yahoo.
hello i discovered your post and thought it was very informational likewise i suggest this site about repairing lap tops Click Here
hello i discovered your post and thought it was very informational likewise i suggest this site about repairing lap tops Click Here